Obsidian community plugin · v2.12.0 · Apache-2.0

Your notes, one year at a glance

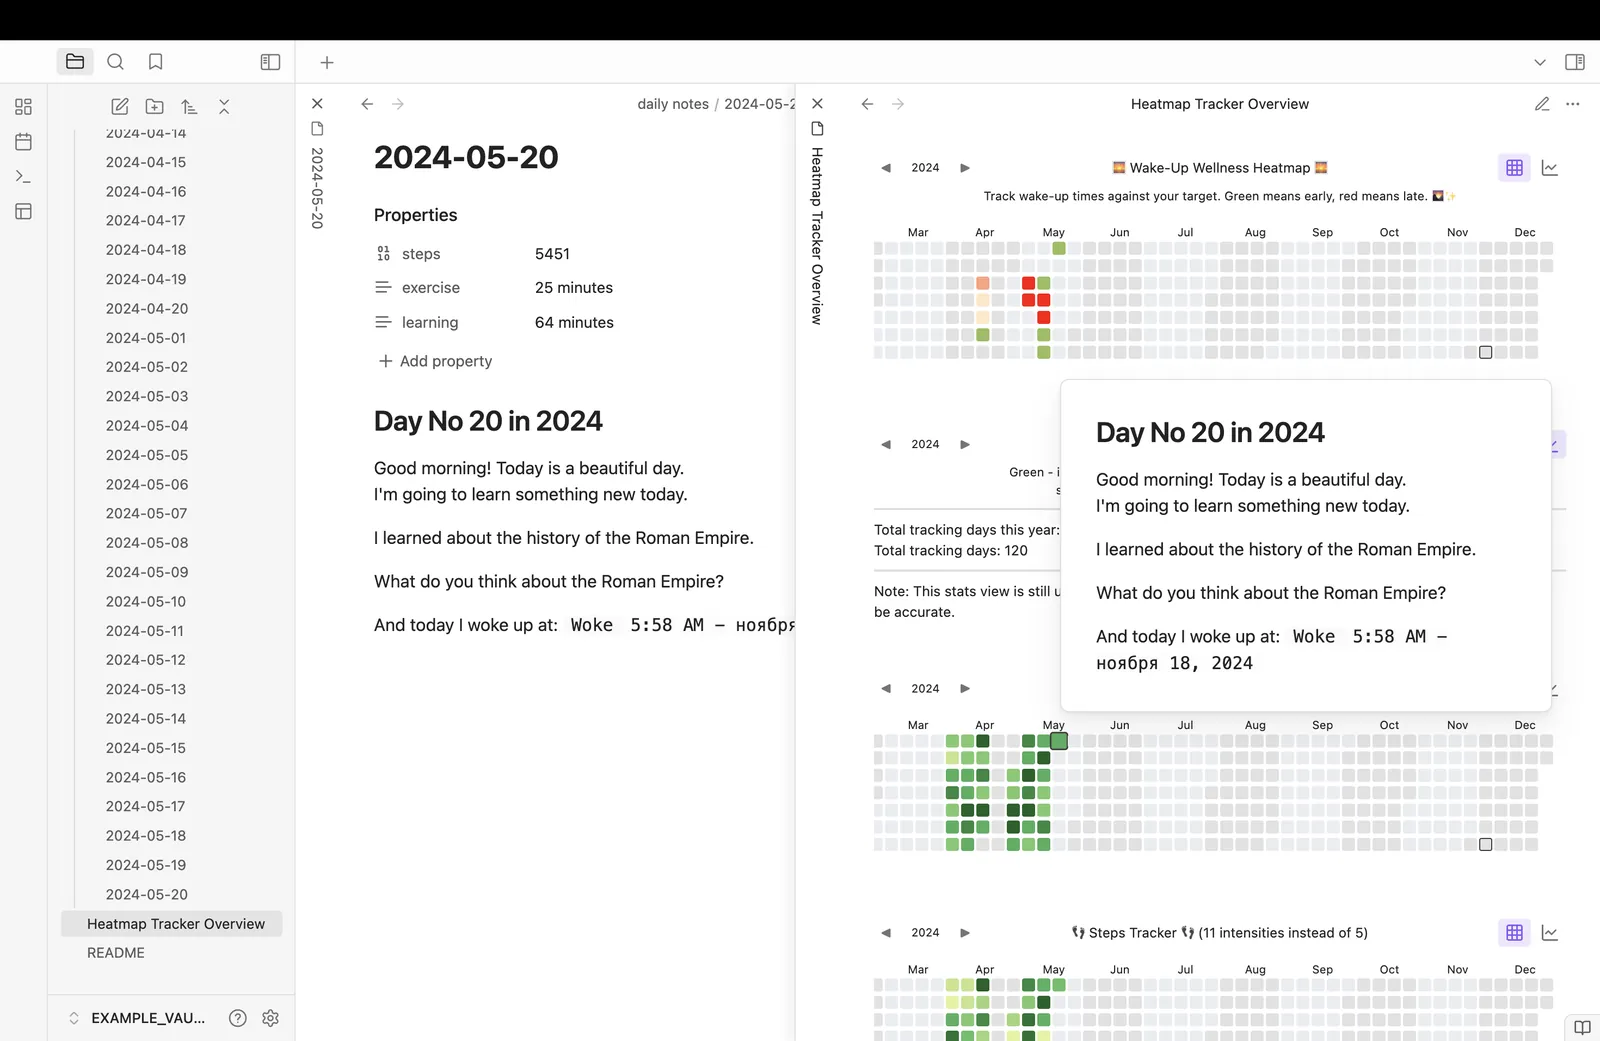
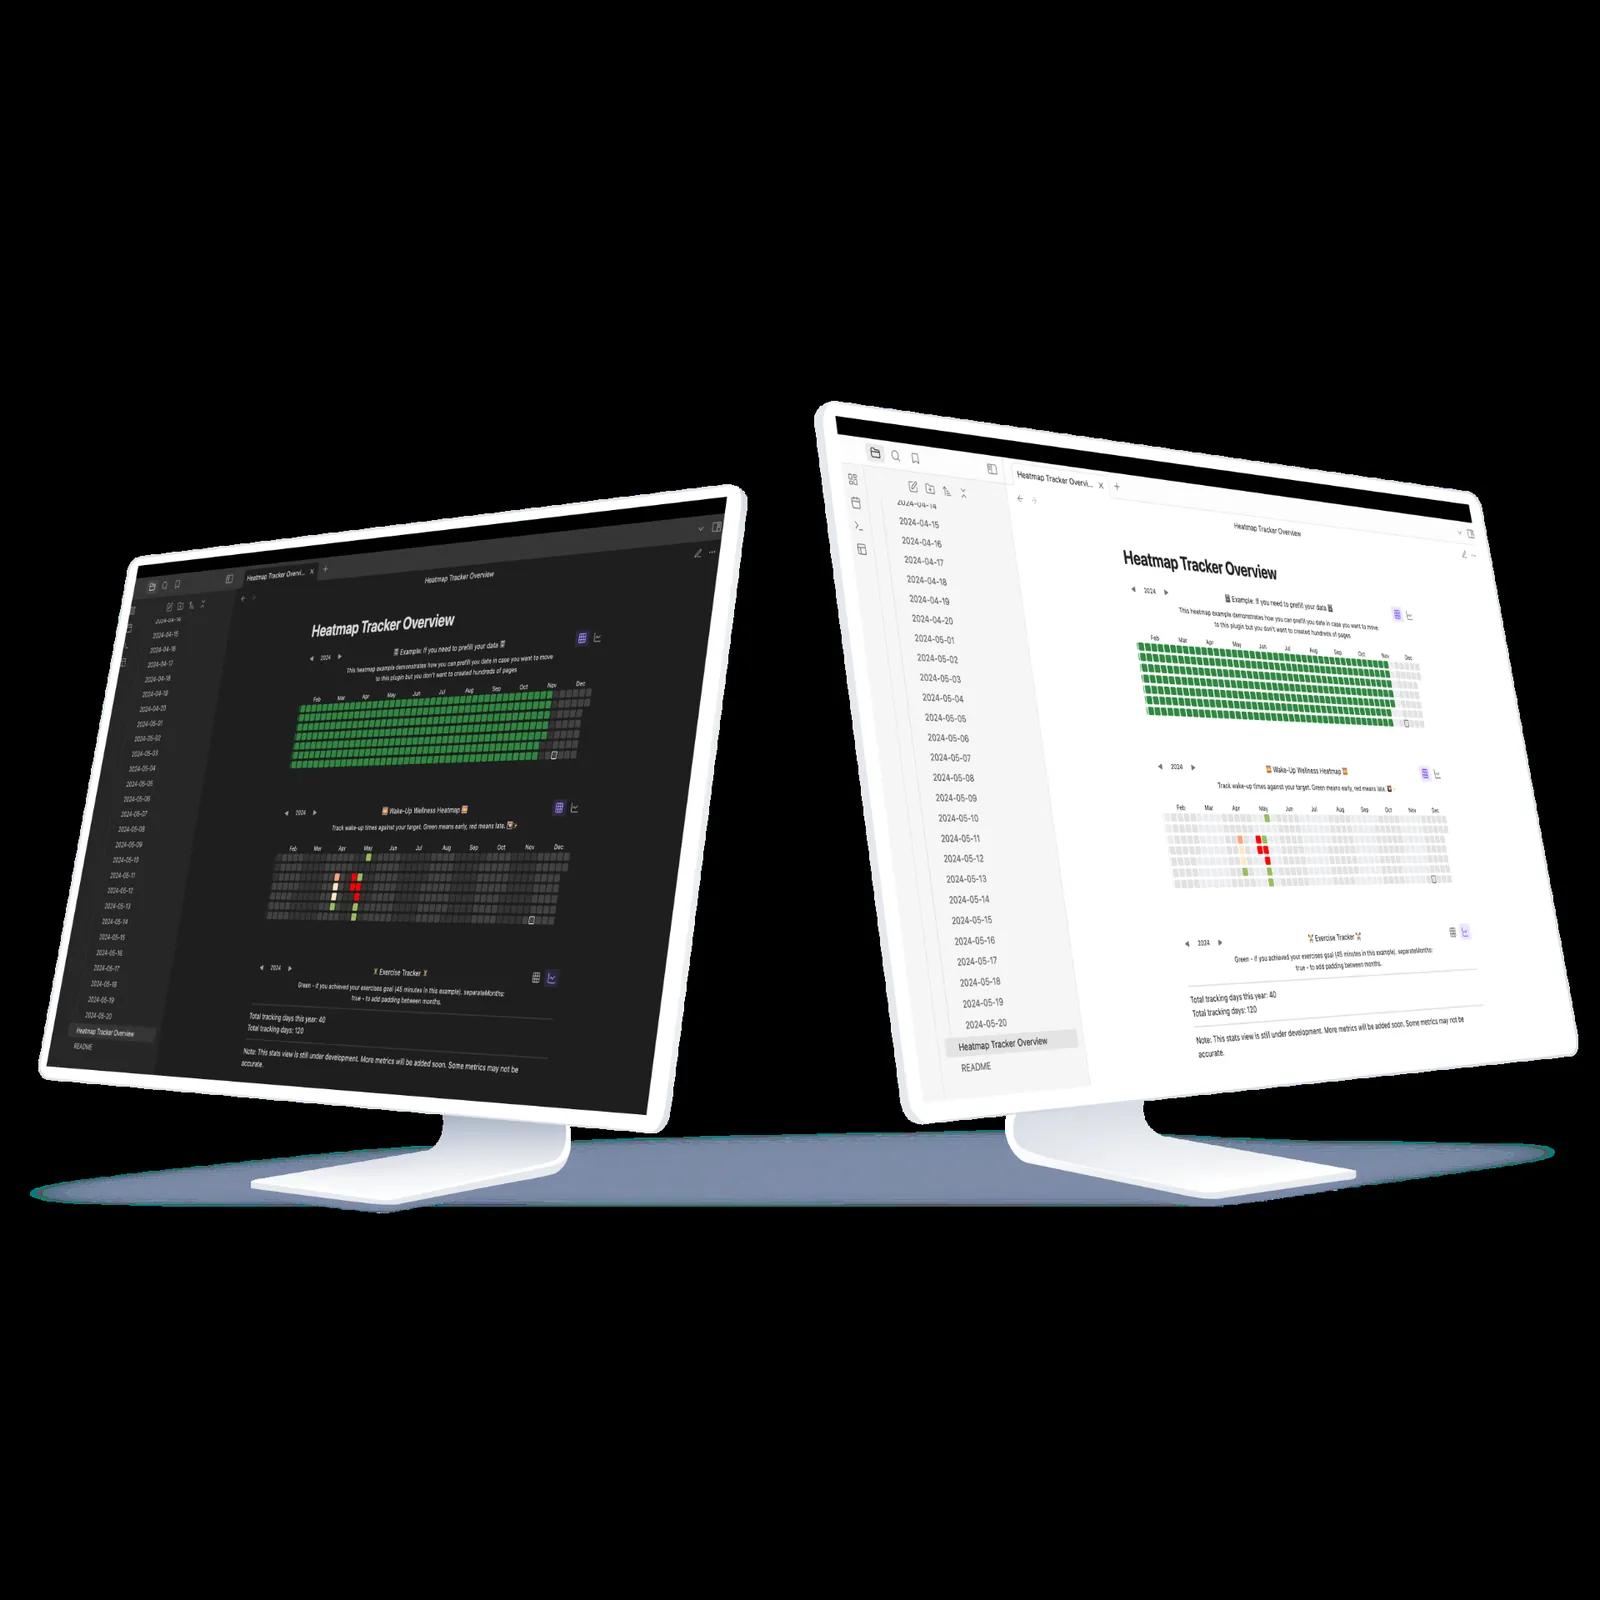
Heatmap Tracker turns any dated note in your Obsidian vault into a GitHub-style heatmap. Habits, workouts, mood, sleep, finances, work logs — anything you already write down. No account, no cloud, no export step.

Free & open source · Desktop and mobile · 9 languages · Your vault stays local

daily-notes/2026.md

Exercise minutes

Read from exercise: in your daily notes

    Works with Dataview Zero config for frontmatter 9 languages Desktop + mobile No telemetry Export to MD / HTML

    How it works

    Three lines. That's the whole setup.

    You already write things down. Heatmap Tracker reads those notes and draws the grid — no database, no sync, no separate app to open.

    1. 1

      Put a value in a note

      Any frontmatter key works. Numbers are used as-is; true counts as 1.

      2026-08-04.md
      ---
      steps: 8420
      mood: 4
      meditated: true
      ---
    2. 2

      Run the Insert Heatmap Tracker command

      The recommended way: fill in the form, watch the live preview, and the codeblock is written for you. Every heatmap keeps an edit button that reopens the same form.

      any note — or write it by hand
      ```heatmap-tracker
      property: steps
      ```
    3. 3

      Read your year

      Hover a square for the details, click it to open that note — or to create it if it isn't there yet.

      narrow it down (optional)
      ```heatmap-tracker
      property: [running, cycling, swimming]
      path: "daily notes"
      tags: [journal]
      ```
    Need full control? A dataviewjs escape hatch lets you build the dataset yourself — computed values, external sources, a custom color per entry — and hand it to renderHeatmapTracker(container, trackerData). See the advanced guide →

    Features

    A tracker, not just a pretty grid

    Everything below ships in the free plugin. No tiers, no upsell, no login wall.

    🎨

    Colors that mean something

    Palettes in settings, customColors per heatmap, or a customColor on a single entry. Set scaleStart/scaleEnd so your values actually spread across the scale.

    📈

    Statistics & custom insights

    A dedicated tab with totals and streaks, plus insights you define yourself: most productive day, longest streak, most active month, average intensity. 12 insights to copy →

    🗓️

    Calendar layouts

    layout: "monthly" for one row per month with days 1–31 as columns, or "month" / "week" for a single wall-calendar period you page through — or keep the classic contribution grid with months visually split.

    ⏱️

    Any date range

    A full year, the last N months, the last N days, or an explicit startDateendDate window.

    📤

    Export a real report

    Markdown or self-contained HTML, with the grid, a legend you label yourself, a summary line and each day's note content grouped by week.

    🖱️

    Click-through to the note

    Every filled square opens the note behind it. Every empty square offers to create it — or stays quiet with disableFileCreation.

    🌍

    Nine languages

    English, German, Russian, Chinese, Hindi, Spanish, French, Portuguese and Polish — with a documented path for adding yours.

    🔒

    Local by design

    Your notes are the database. Nothing is uploaded, nothing is synced, nothing is measured. Open source under Apache-2.0.

    Heatmap Tracker inside Obsidian showing a yearly grid, statistics and insights

    Use cases

    Ten trackers people actually keep

    Each one is a single frontmatter key. Every example below ships in the example vault.

    🏃

    Fitness

    exercise: 45

    Spot the weeks you skipped, not just the total.

    🧘

    Habits

    meditated: true

    Streaks become visible — and hard to break.

    😴

    Sleep

    hours-slept: 7.5

    See the slow drift before it becomes a problem.

    🙂

    Mood

    mood: 4

    Correlate bad stretches with what else was happening.

    💰

    Finance

    spent: 120

    A year of spending on one screen.

    📚

    Reading

    pages-read: 30

    Small daily numbers add up visibly.

    💧

    Water intake

    water: 6

    Zero-effort adherence check.

    💼

    Work log

    hours: 8

    Export it as a report for your manager.

    🤕

    Symptoms

    headache: 3

    Bring a real timeline to your doctor.

    Projects

    tasks-done: 5

    Momentum, not just a burn-down chart.

    Export

    From a year of notes to one shareable report

    The Export tab sits between a bare calendar (too little context) and a folder of raw notes (too much noise): the grid, rendered pixel-for-pixel like your heatmap, then every day's own note content underneath it, grouped by week.

    • Weeks as columns or rows, with automatic wrapping for wide ranges
    • Range presets: logged, last year, year to date, last month, month to date
    • A legend editor pre-filled with the colors your data actually uses
    • A summary line like Workday: 22 · Leave: 1 with a total
    • Save as Markdown or a self-contained HTML file, anywhere in your vault

    Read the export docs

    An exported Heatmap Tracker report shown next to the heatmap it was generated from

    Install

    Two minutes, from inside Obsidian

    1 · Community plugins

    Settings → Community plugins, turn Restricted mode off, hit Browse and search for Heatmap Tracker. Install, then enable.

    Open the plugin page

    2 · Add Dataview

    The heatmap-tracker codeblock reads your notes through Dataview. Install it the same way; for dataviewjs examples also enable Enable JavaScript Queries.

    3 · Or do it by hand

    Drop main.js, styles.css and manifest.json from the latest release into <vault>/.obsidian/plugins/heatmap-tracker/. Beta builds go through BRAT.

    Latest release

    How it compares

    Grown out of heatmap-calendar

    Heatmap Tracker began as a rewrite of the excellent heatmap-calendar-obsidian by Richardsl, and went further. If all you need is a one-year grid from a dataviewjs script, the original is lighter.

    Capability Heatmap Tracker heatmap-calendar
    Codeblock without JavaScript Yes dataviewjs required
    Interactive insert command Modal builder No
    Statistics & custom insights Yes No
    Monthly (calendar) layout Yes No
    Single month / week view Yes No
    Flexible date ranges Days, months, explicit range Full year
    Export to Markdown / HTML Yes No
    Localization 9 languages No
    Click to open and create notes Yes Partial

    FAQ

    Questions people actually ask

    Does my data leave my vault?

    No. Everything is computed locally from your notes. There's no account, no sync, no telemetry.

    Do I need Dataview?

    For the no-code heatmap-tracker codeblock, yes — that's how notes are read. But renderHeatmapTracker(container, trackerData) accepts any entries array, so any JavaScript that can build one works.

    Does it work on Obsidian mobile?

    Yes. The plugin isn't desktop-only; iOS and Android are supported.

    My heatmap is empty — what do I check?

    In order: Dataview enabled; the property name spelled exactly right (it's case-sensitive); your notes inside the searched folder (set path if they're not); the displayed year matching your data. A missing property logs a warning in devtools.

    All my squares are the same color

    Your values are landing in one bucket. Bracket the range you care about with intensityConfig.scaleStart and scaleEnd — e.g. 30120 for reading minutes.

    Dates are off by one day

    Almost always a timezone issue in how the date was parsed. Use plain YYYY-MM-DD strings for date rather than Date objects or ISO timestamps with a time component.

    Can one heatmap show several properties?

    Yes — property: [running, cycling, swimming]. The values are aggregated into a single heatmap.

    What does it cost?

    Nothing. Free and open source under Apache-2.0. If it saves you time, you can buy the author a coffee — entirely optional.

    Still stuck? Open an issue with your codeblock, a sample note and your versions.

    Start tracking tonight's note

    Free, open source, and it reads the notes you're already writing. One codeblock and your year shows up.